Chapter 4 Missing Values
As mentioned above, we fill all empty slots in the original dataset with NAs. Then we draw a graph using extracat::visna to visualize the missing patterns of our dataset. The columns represent the 28 variables and the rows the missing patterns. The cells for the variables with missing values in a pattern are drawn in blue. The variables and patterns have been ordered by numbers of missings on both rows and columns. The bars beneath the columns show the proportions of missings by variable and the bars on the right show the relative frequencies of patterns.
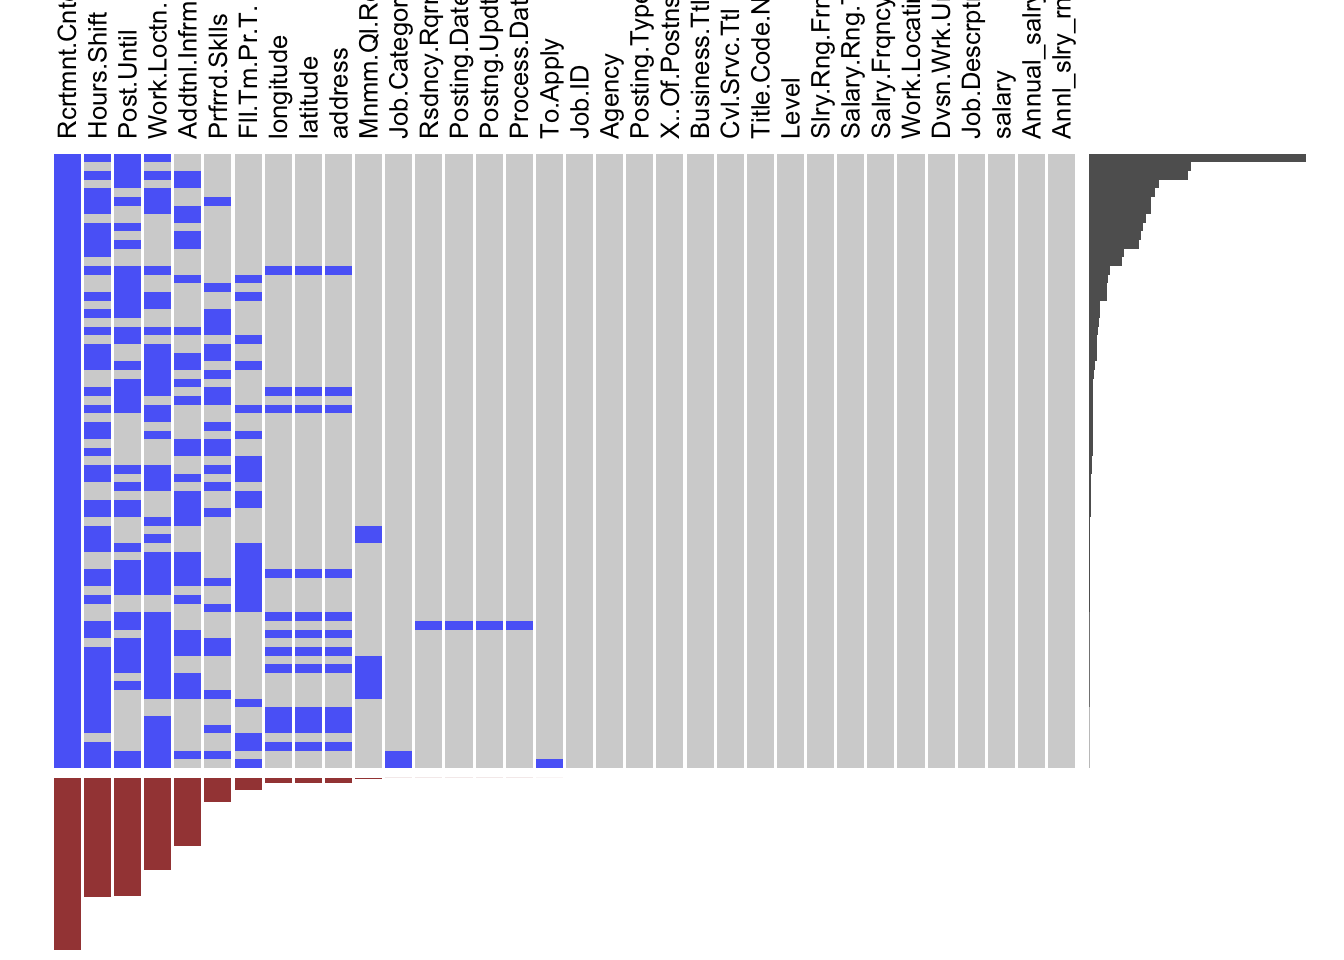
From the plot, we can tell that all values under the column Recruitment Contact are missing. Therefore, we decide to drop this column from our data frame. For other columns, we will keep these NAs for now, but we try not to make our analysis depend heavily on the column Hours.shift ,Post.until and Work Location 1 because those columns have lots of missings. Furthermore, we need to be careful when to delete NA values. Because in our dataset we have lots of categorical variables and NA in those categorical variables might be one of the factor levels. For example in the level variable, the NA values mean entry-level and we transformed those NA values as one-factor level.